Building from a period of sustained economic growth, Canberra’s economy is now among the strongest in the country. Our economy is expected to have grown by 13.6 per cent over the past three years as we continue to diversify our economic base. Canberra has become an attractive location for tourists, students, new industries and investors, and this is driving our economy forward.
Our strong economic growth saw the creation of around 10,000 new jobs last year – almost all of them full time. There are over 2,000 more businesses operating in Canberra today than there were three years ago. And our companies are doing more international business than ever before, with the ACT’s services exports rising by 22 per cent since 2015.
Budget in balance every year across the forward estimates
Outlook is bright
The 2018 Budget forecasts continued strong growth in jobs and economic activity in the years ahead.
This will be driven by a diverse range of industries, including education, tourism and advanced knowledge industries.
With around 17,000 international students studying in Canberra, international education is our largest export – expanding by 24 per cent in 2016-17 and contributing three quarters of a billion dollars a year to our economy. Canberra is Australia’s largest exporter of international education per capita, and the prospects for further growth are good as providers like UNSW explore expansion.
With more international airlines flying to Canberra, and our city being recognised internationally as one of Lonely Planet’s top cities to visit, the outlook for our tourism sector is very bright. The ACT Government has a goal of overnight tourist visitors contributing $2.5 billion to our economy by December 2020, and we are on track to achieve it.
We also expect to see more jobs created in a range of key knowledge-based industries, including technology systems design, cyber security, defence, research and private contracting. Our professional, scientific and technical services sector grew by 34.6 per cent in 2016-17, showing that Canberra’s local innovation companies are thriving.
Table 1: ACT economic forecasts, 2018-19 Budget
| Actual | Estimate | Forecast | Projections | |||
|---|---|---|---|---|---|---|
| 2016-17 | 2017-18 | 2018-19 | 2019-20 | 2020-21 | 2021-22 | |
| Gross State Product | 4.6 | 4½ (+½) | 3½ (+¼) | 3½ (+1) | 3½ (+1) | 3½ |
| State Final Demand | 3.5 (+0.1) | 4 (+¾) | 3 (+¼) | 3¼ (-¾) | 3¾ (-¼) | 3¾ |
| Employment | 1.7 | 3 (-1½) | 2 | 1½ | 1½ | 1½ |
| Wage Price Index | 1.9 | 2 | 2½ (+¼) | 2¾ (-¼) | 3¼ (+¼) | 3¼ |
| Consumer Price Index | 2.1 | 2¼ | 2 ¼ | 2½ | 2½ | 2½ |
| Population | 1.7 | 1¾ | 1¾ (+¼) | 1¾ (+¼) | 1½ | 1½ |
Note: numbers in ( ) show change from estimates, forecasts and projections in the February 2017-18 Budget Review.
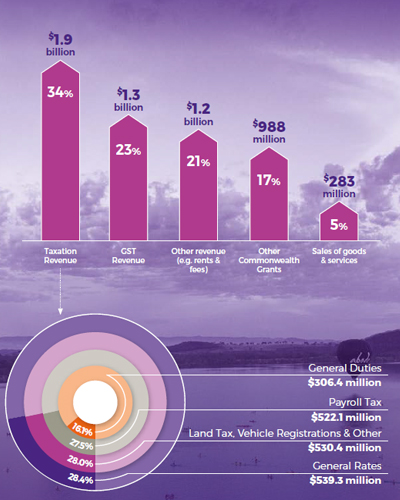
Where our money comes from
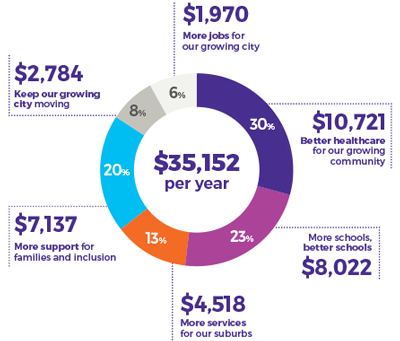
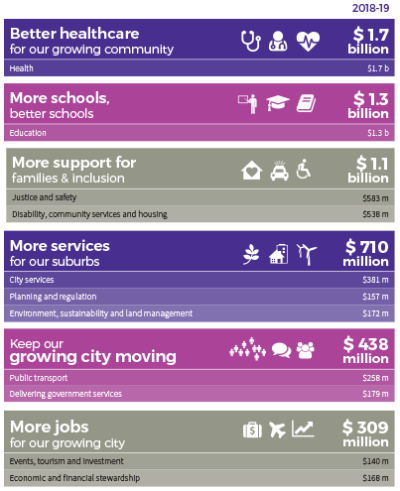
Where our money goes
For each Canberra household, on average the Government delivers...